
The graph editor
Last updated
The graph editor draws a property as a line of value, or rate of change, against time.
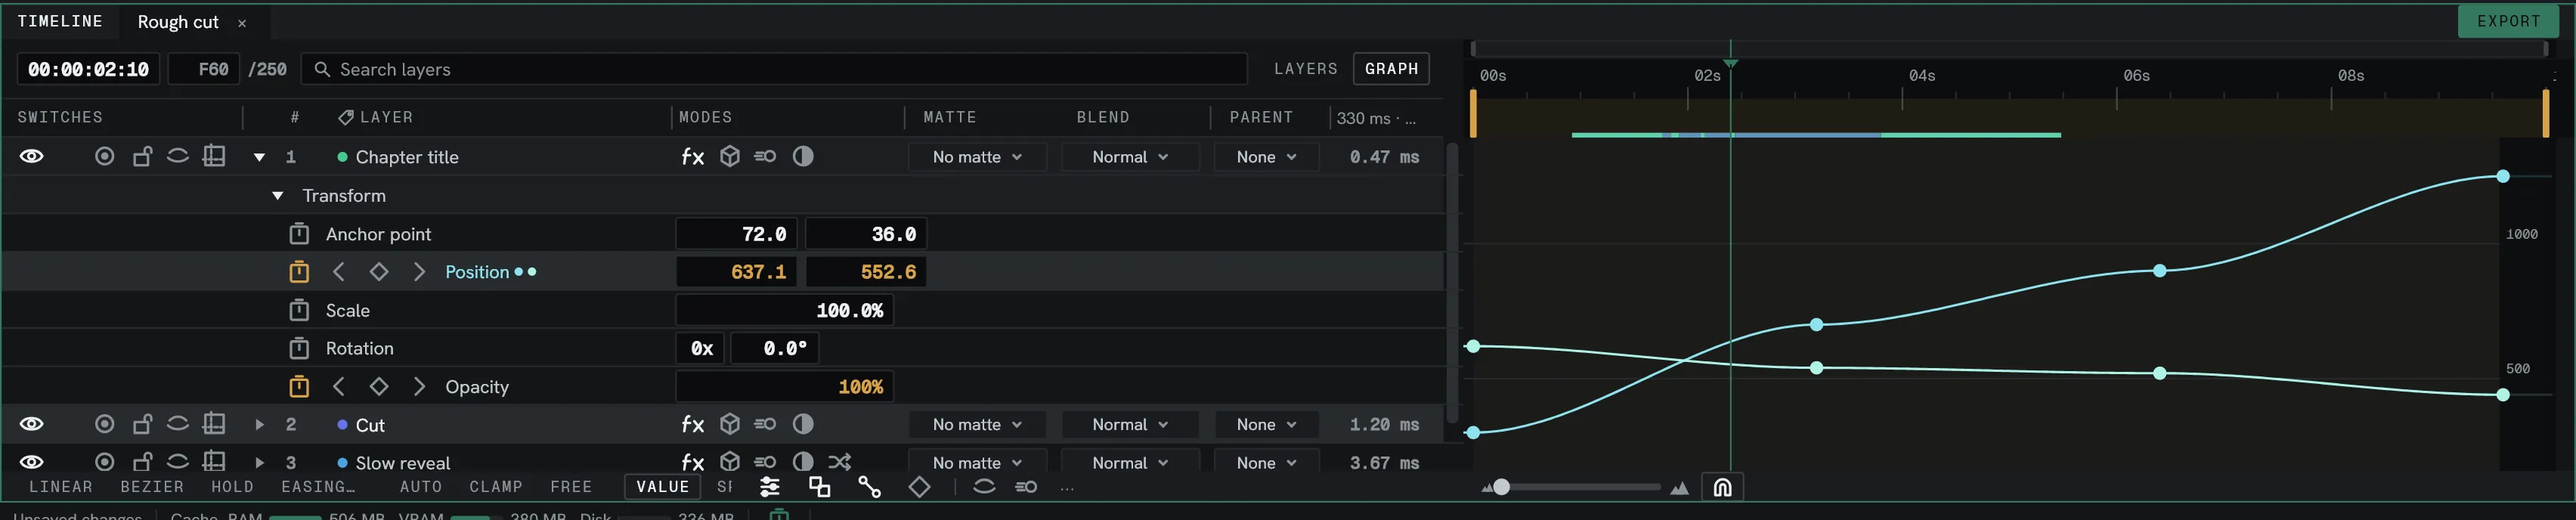
The two views
Section titled “The two views”| View | Shows |
|---|---|
| Value graph | The value against time. |
| Speed graph | The rate of change against time. |
Both views show the same underlying data. Editing either affects the other.
Edit a curve
Section titled “Edit a curve”- Drag a keyframe to change its value and time.
- Drag a handle to change the curve’s shape.
- Select several keyframes to move them together.
To change a keyframe between linear, bezier, or hold, press the relevant button at the
bottom of the graph editor. The default shortcut to switch to bezier is F9.
Retime in the graph editor
Section titled “Retime in the graph editor”The Retime graph displays the layer’s exact time value by default. Toggle Edit ▸ Settings ▸ Interface ▸ Retime opens to Speed to display speed as the y axis instead, as a percentage. Speed starts at 100% and can be edited, including to negative values.
See Retiming and speed.